Curator Dashboard
The Curator Dashboard is GraphGrid's user-interface. Within Curator, teams can create, collaborate, and share projects. While overseeing the presentation of data, Curator integrates with other GraphGrid services such as Search and Publish to provide a fully integrated experience, capable of handling a spectrum of simple to demanding projects. Curator includes a dashboard management interface which builds on top of several core modules that perform core graph visualization rendering and interoperability.
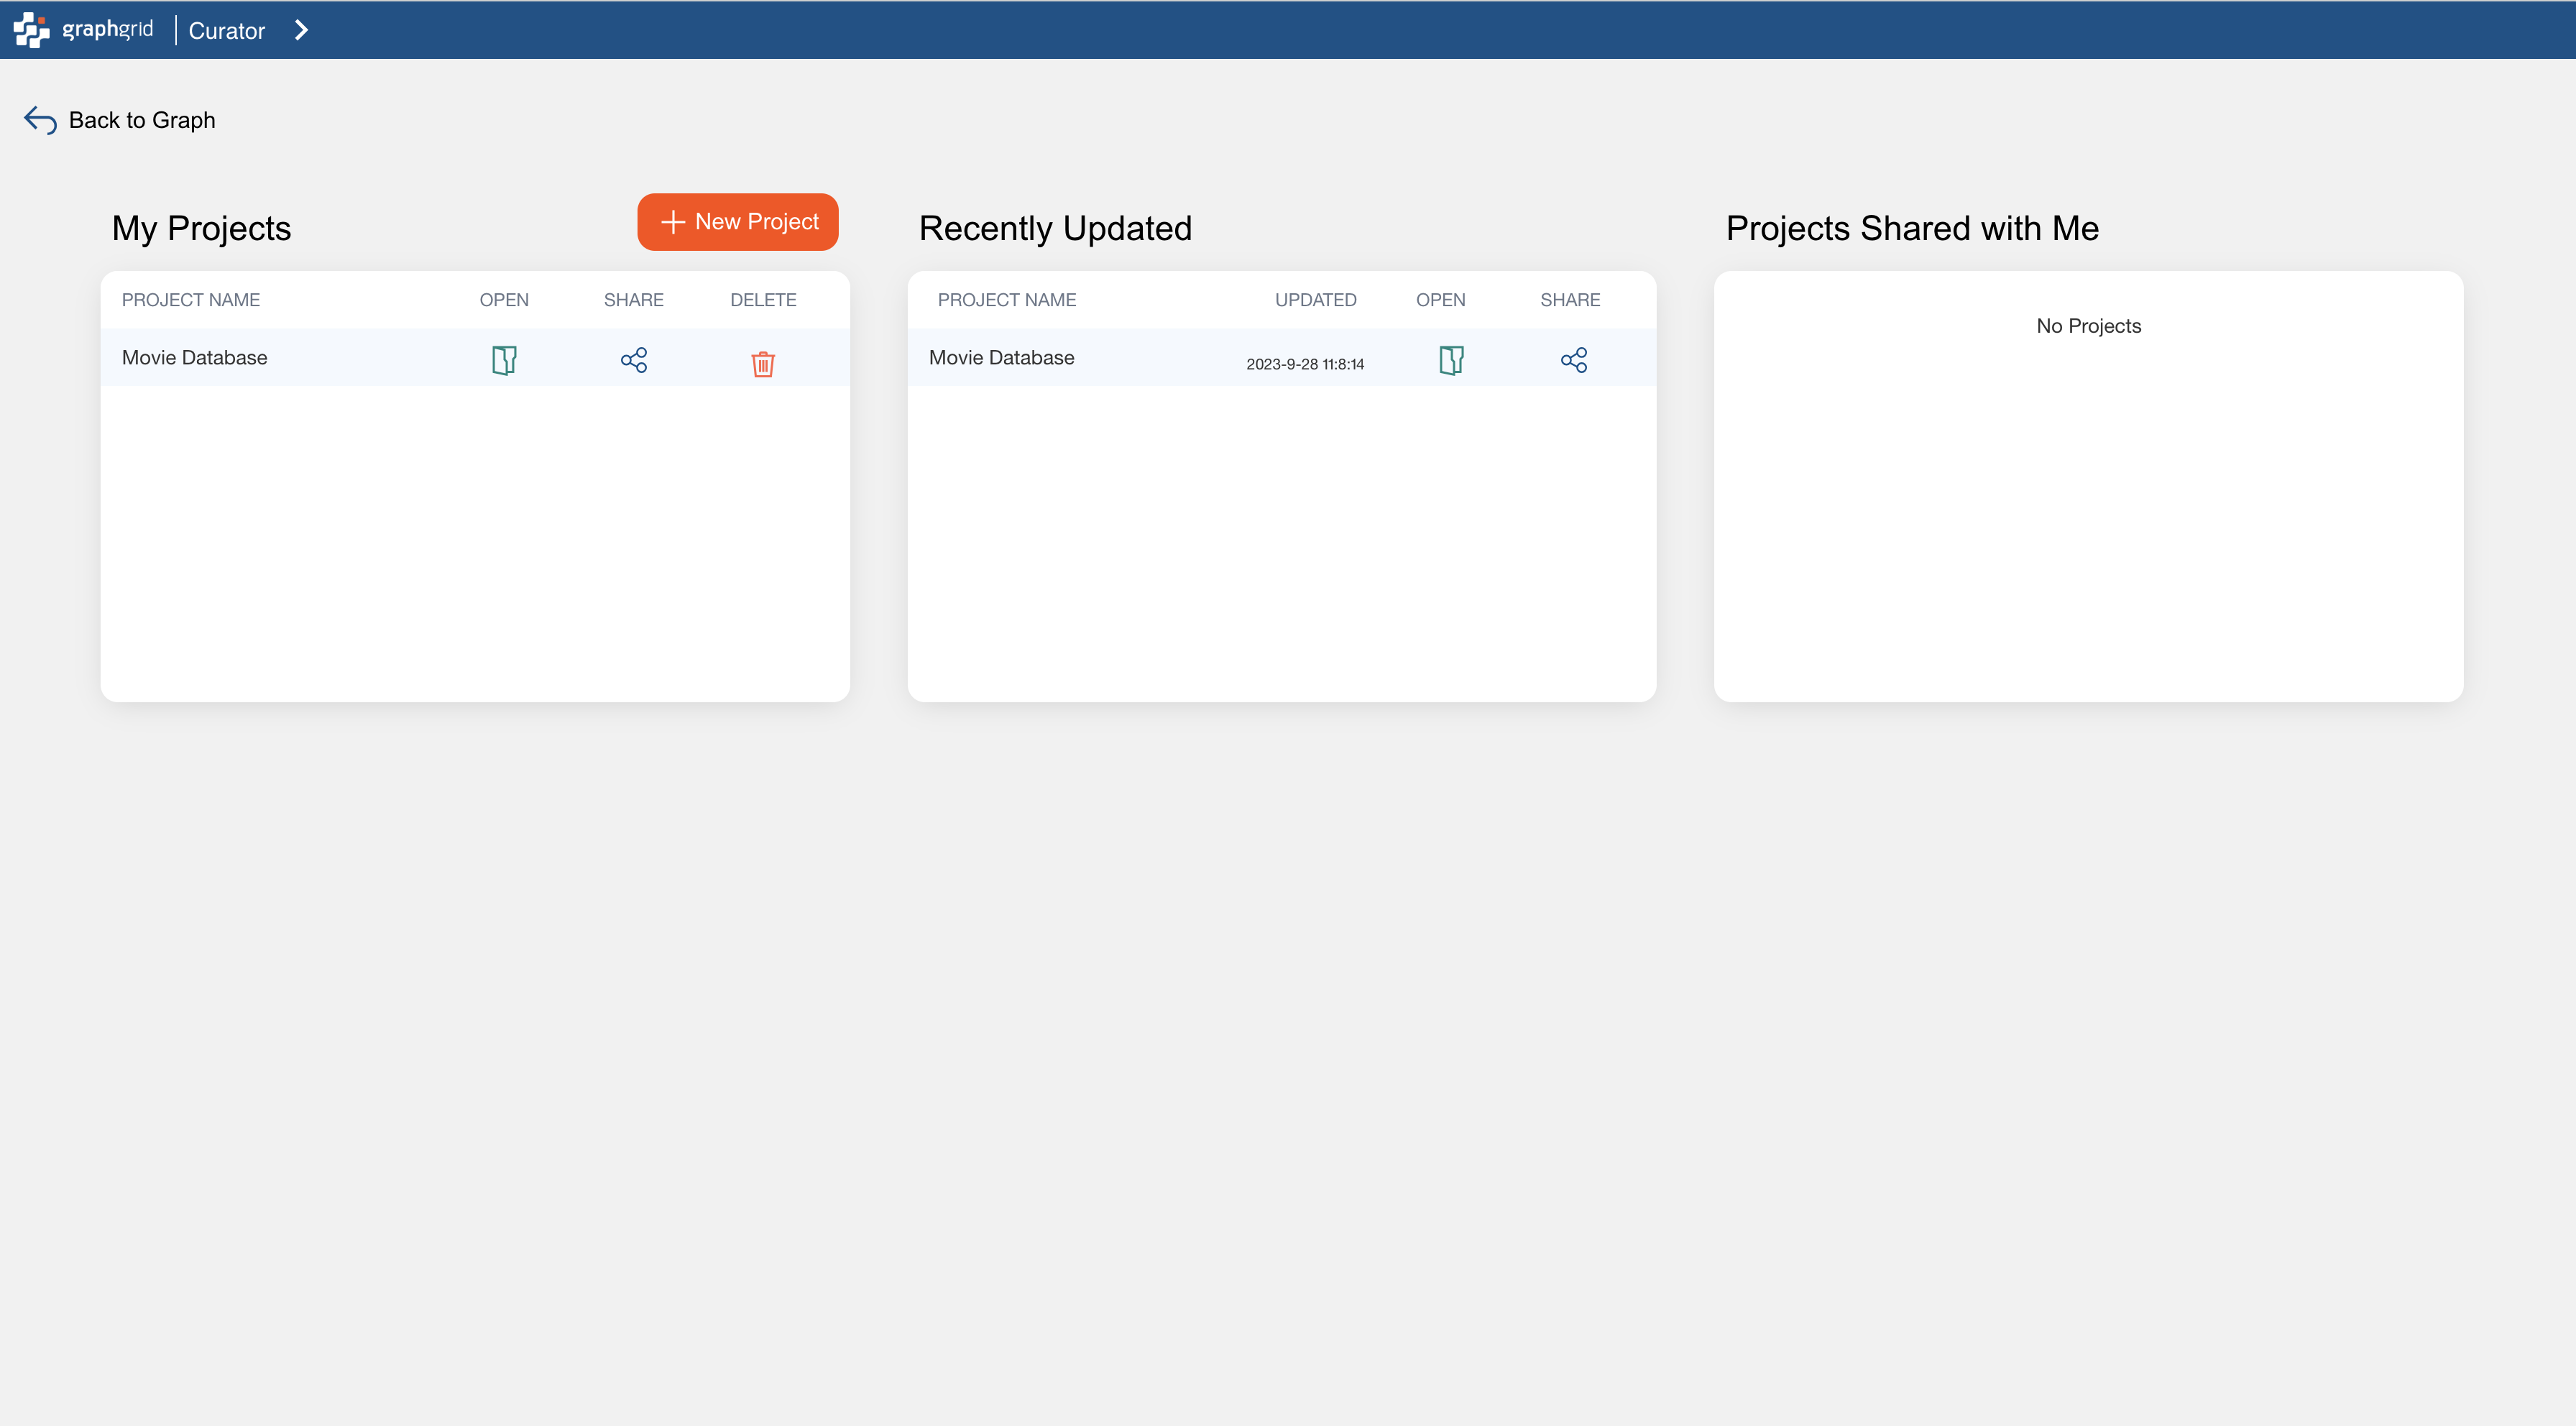
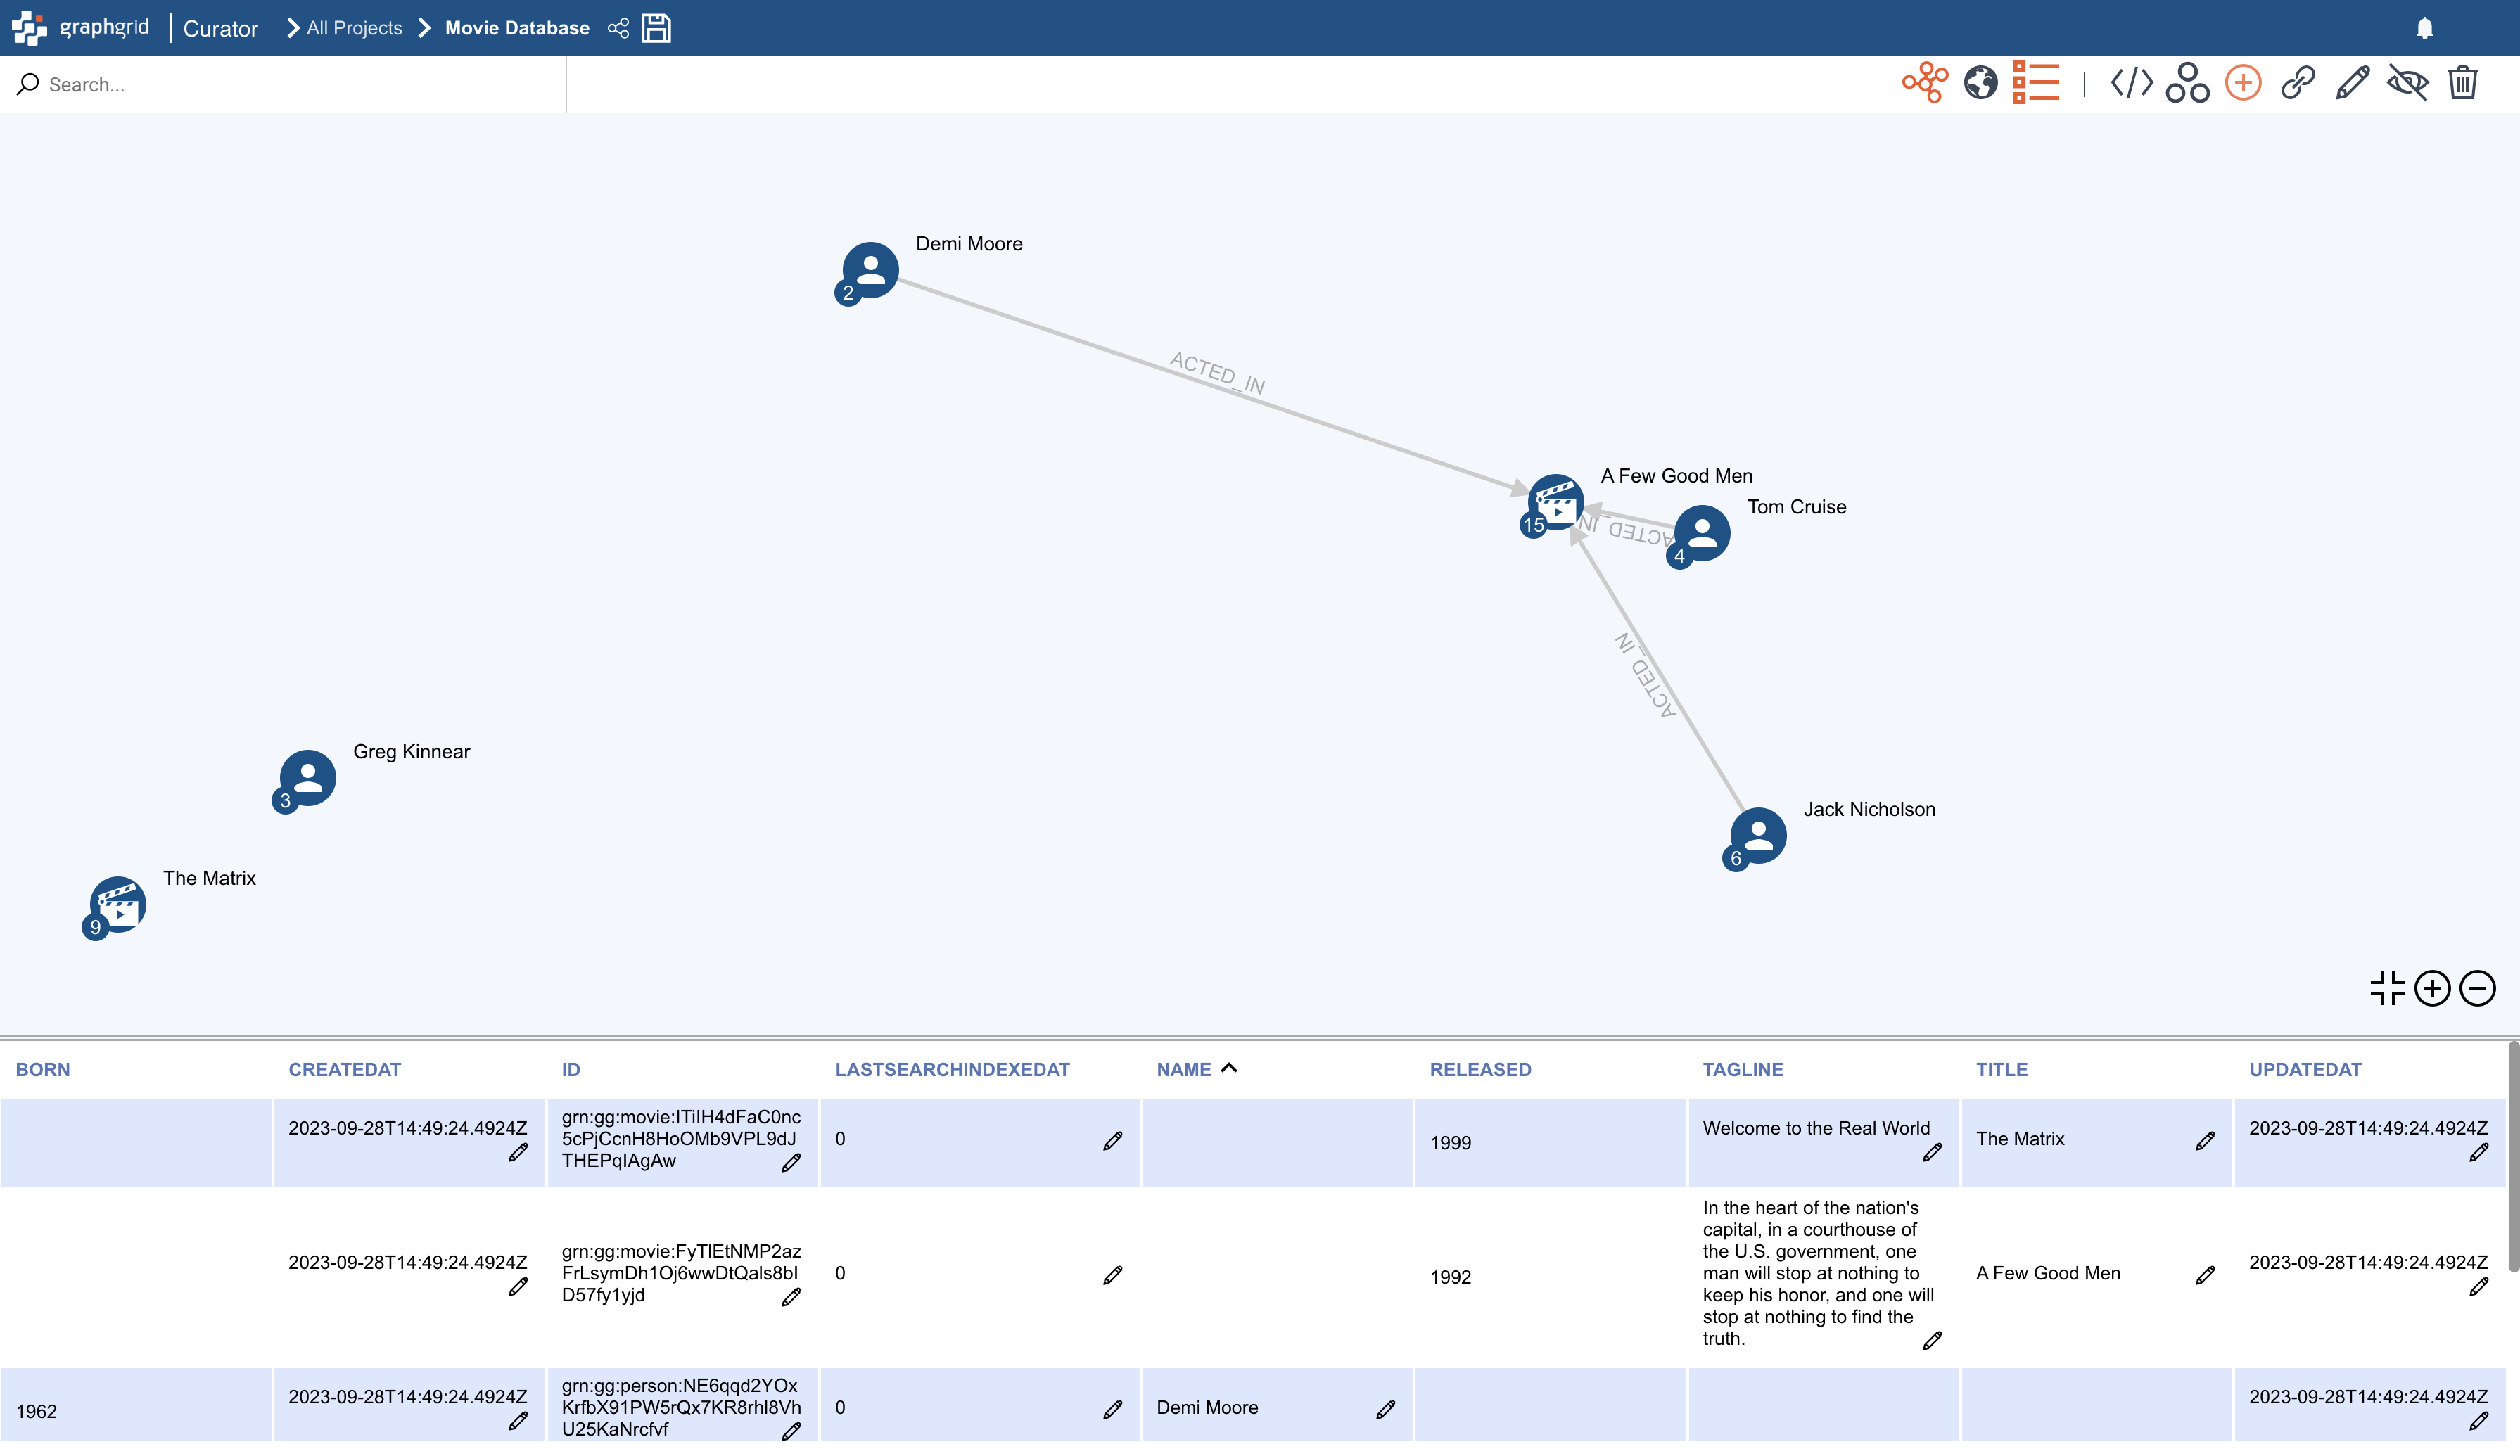
Pictured above is the Curator Dashboard. To log in, users should go to localhost/login in their browser. The default
username and password are both graphgrid (to change the defaults, use the update user and password endpoints with the GraphGrid Security API).
Once logged in, users can create or view projects organized within the Curator homepage.
Opening a project will provide an interactive graph visualization. Graph data from the integrated graph database service, ONgDB can be accessed and displayed within a project.
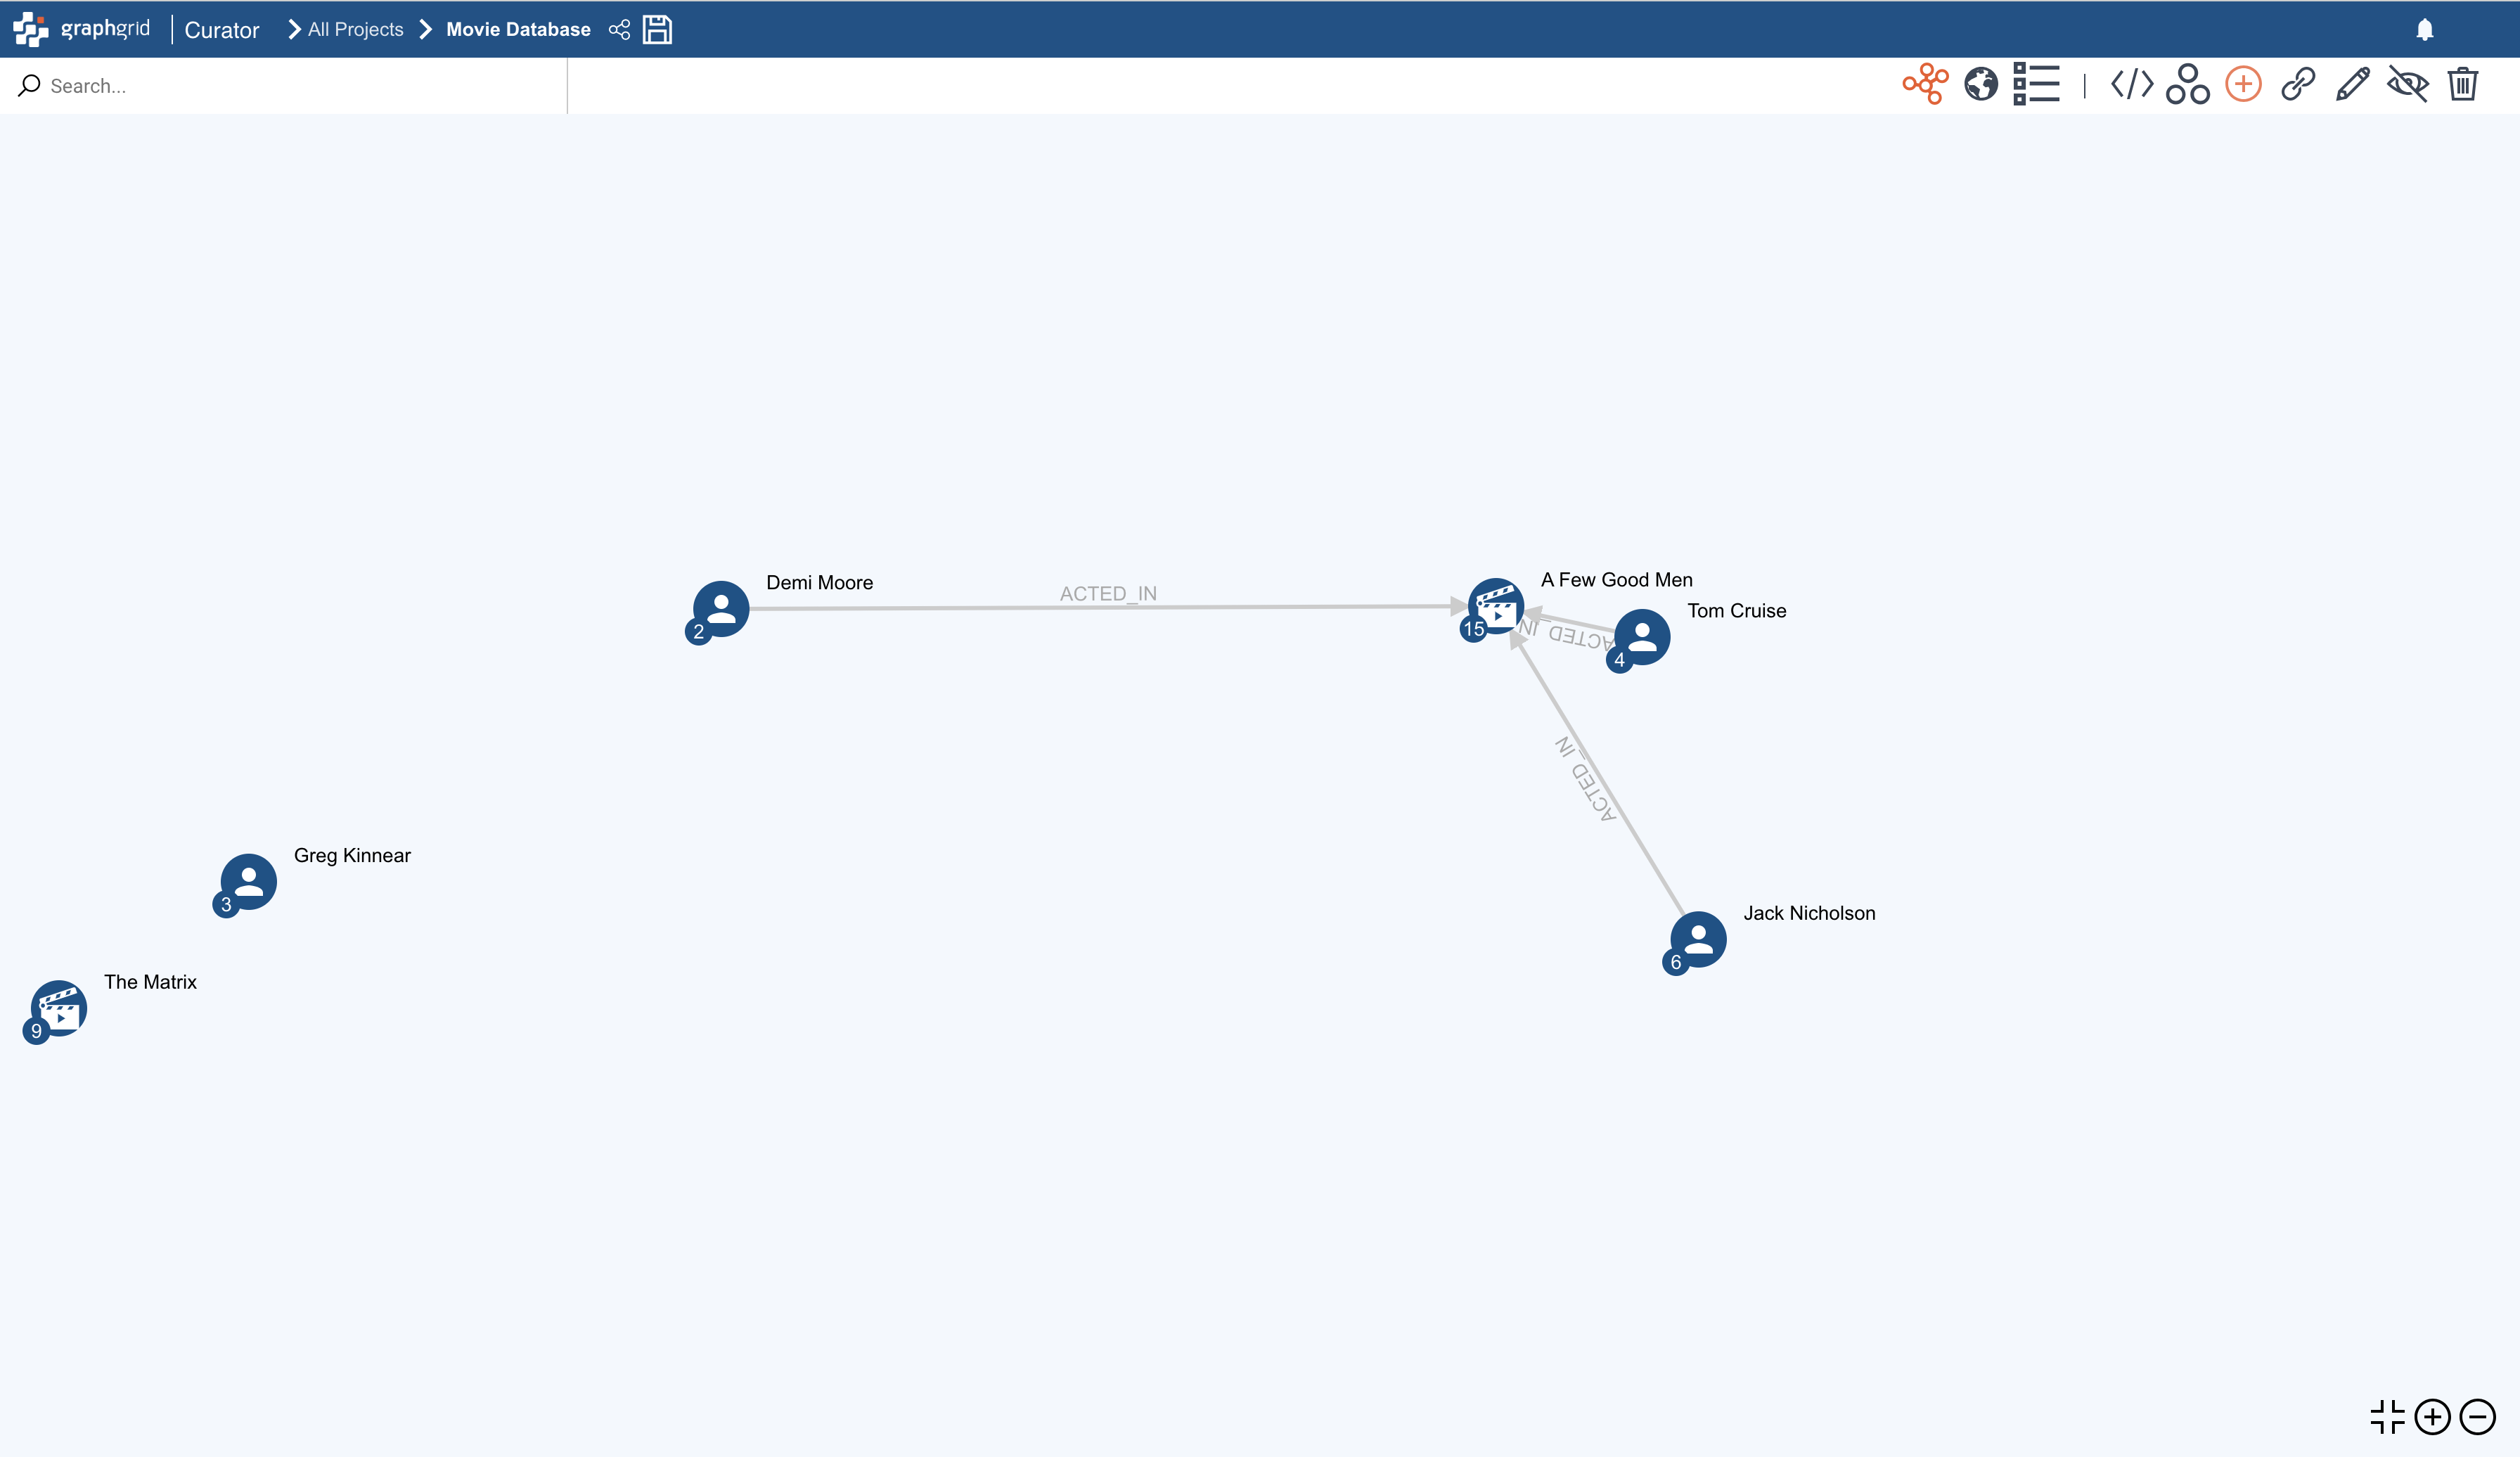
From here, users can analyze the graph data by exploring connects and expanding nodes.
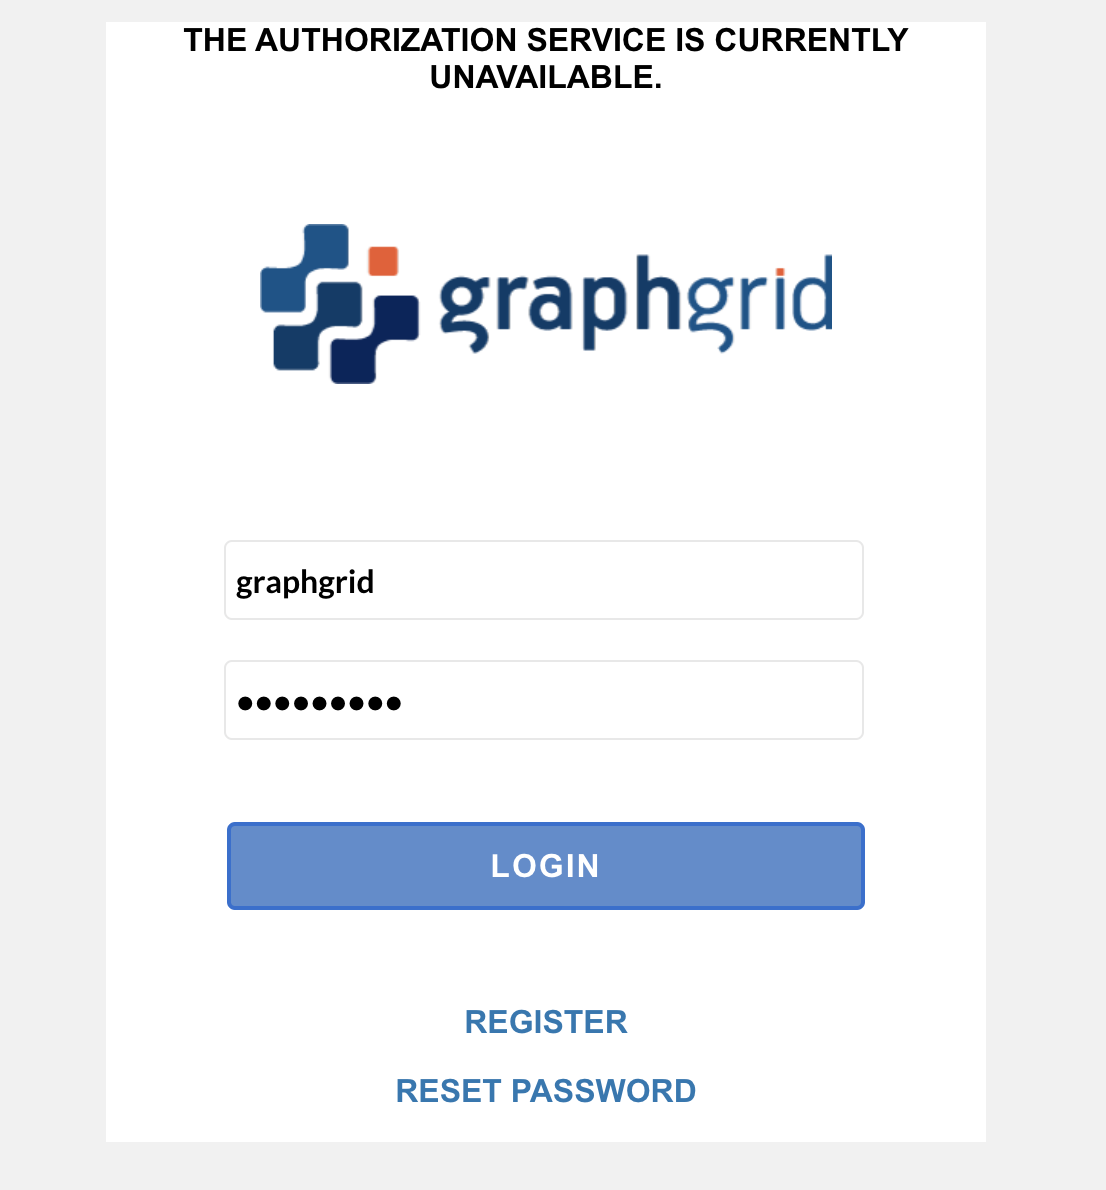
If a user receives an error that "The Authorization Service is Currently Unavailable" while attempting to log in, it means
that GraphGrid Security services are currently down or likely starting up. Allow GraphGrid Security to fully start before
attempting to log in to the Curator dashboard. To check the status of security, users can either run the security status
endpoint or run docker-compose logs -f security in a terminal to get the logs for the security module.
Actions
Several actions can be preformed within a Curator Project. All actions are displayed in the upper right corner.

Curator Views
The buttons to the left control the Curator view.

Graph View

This view will give the graph view. Project data will be displayed as labeled nodes and edges.
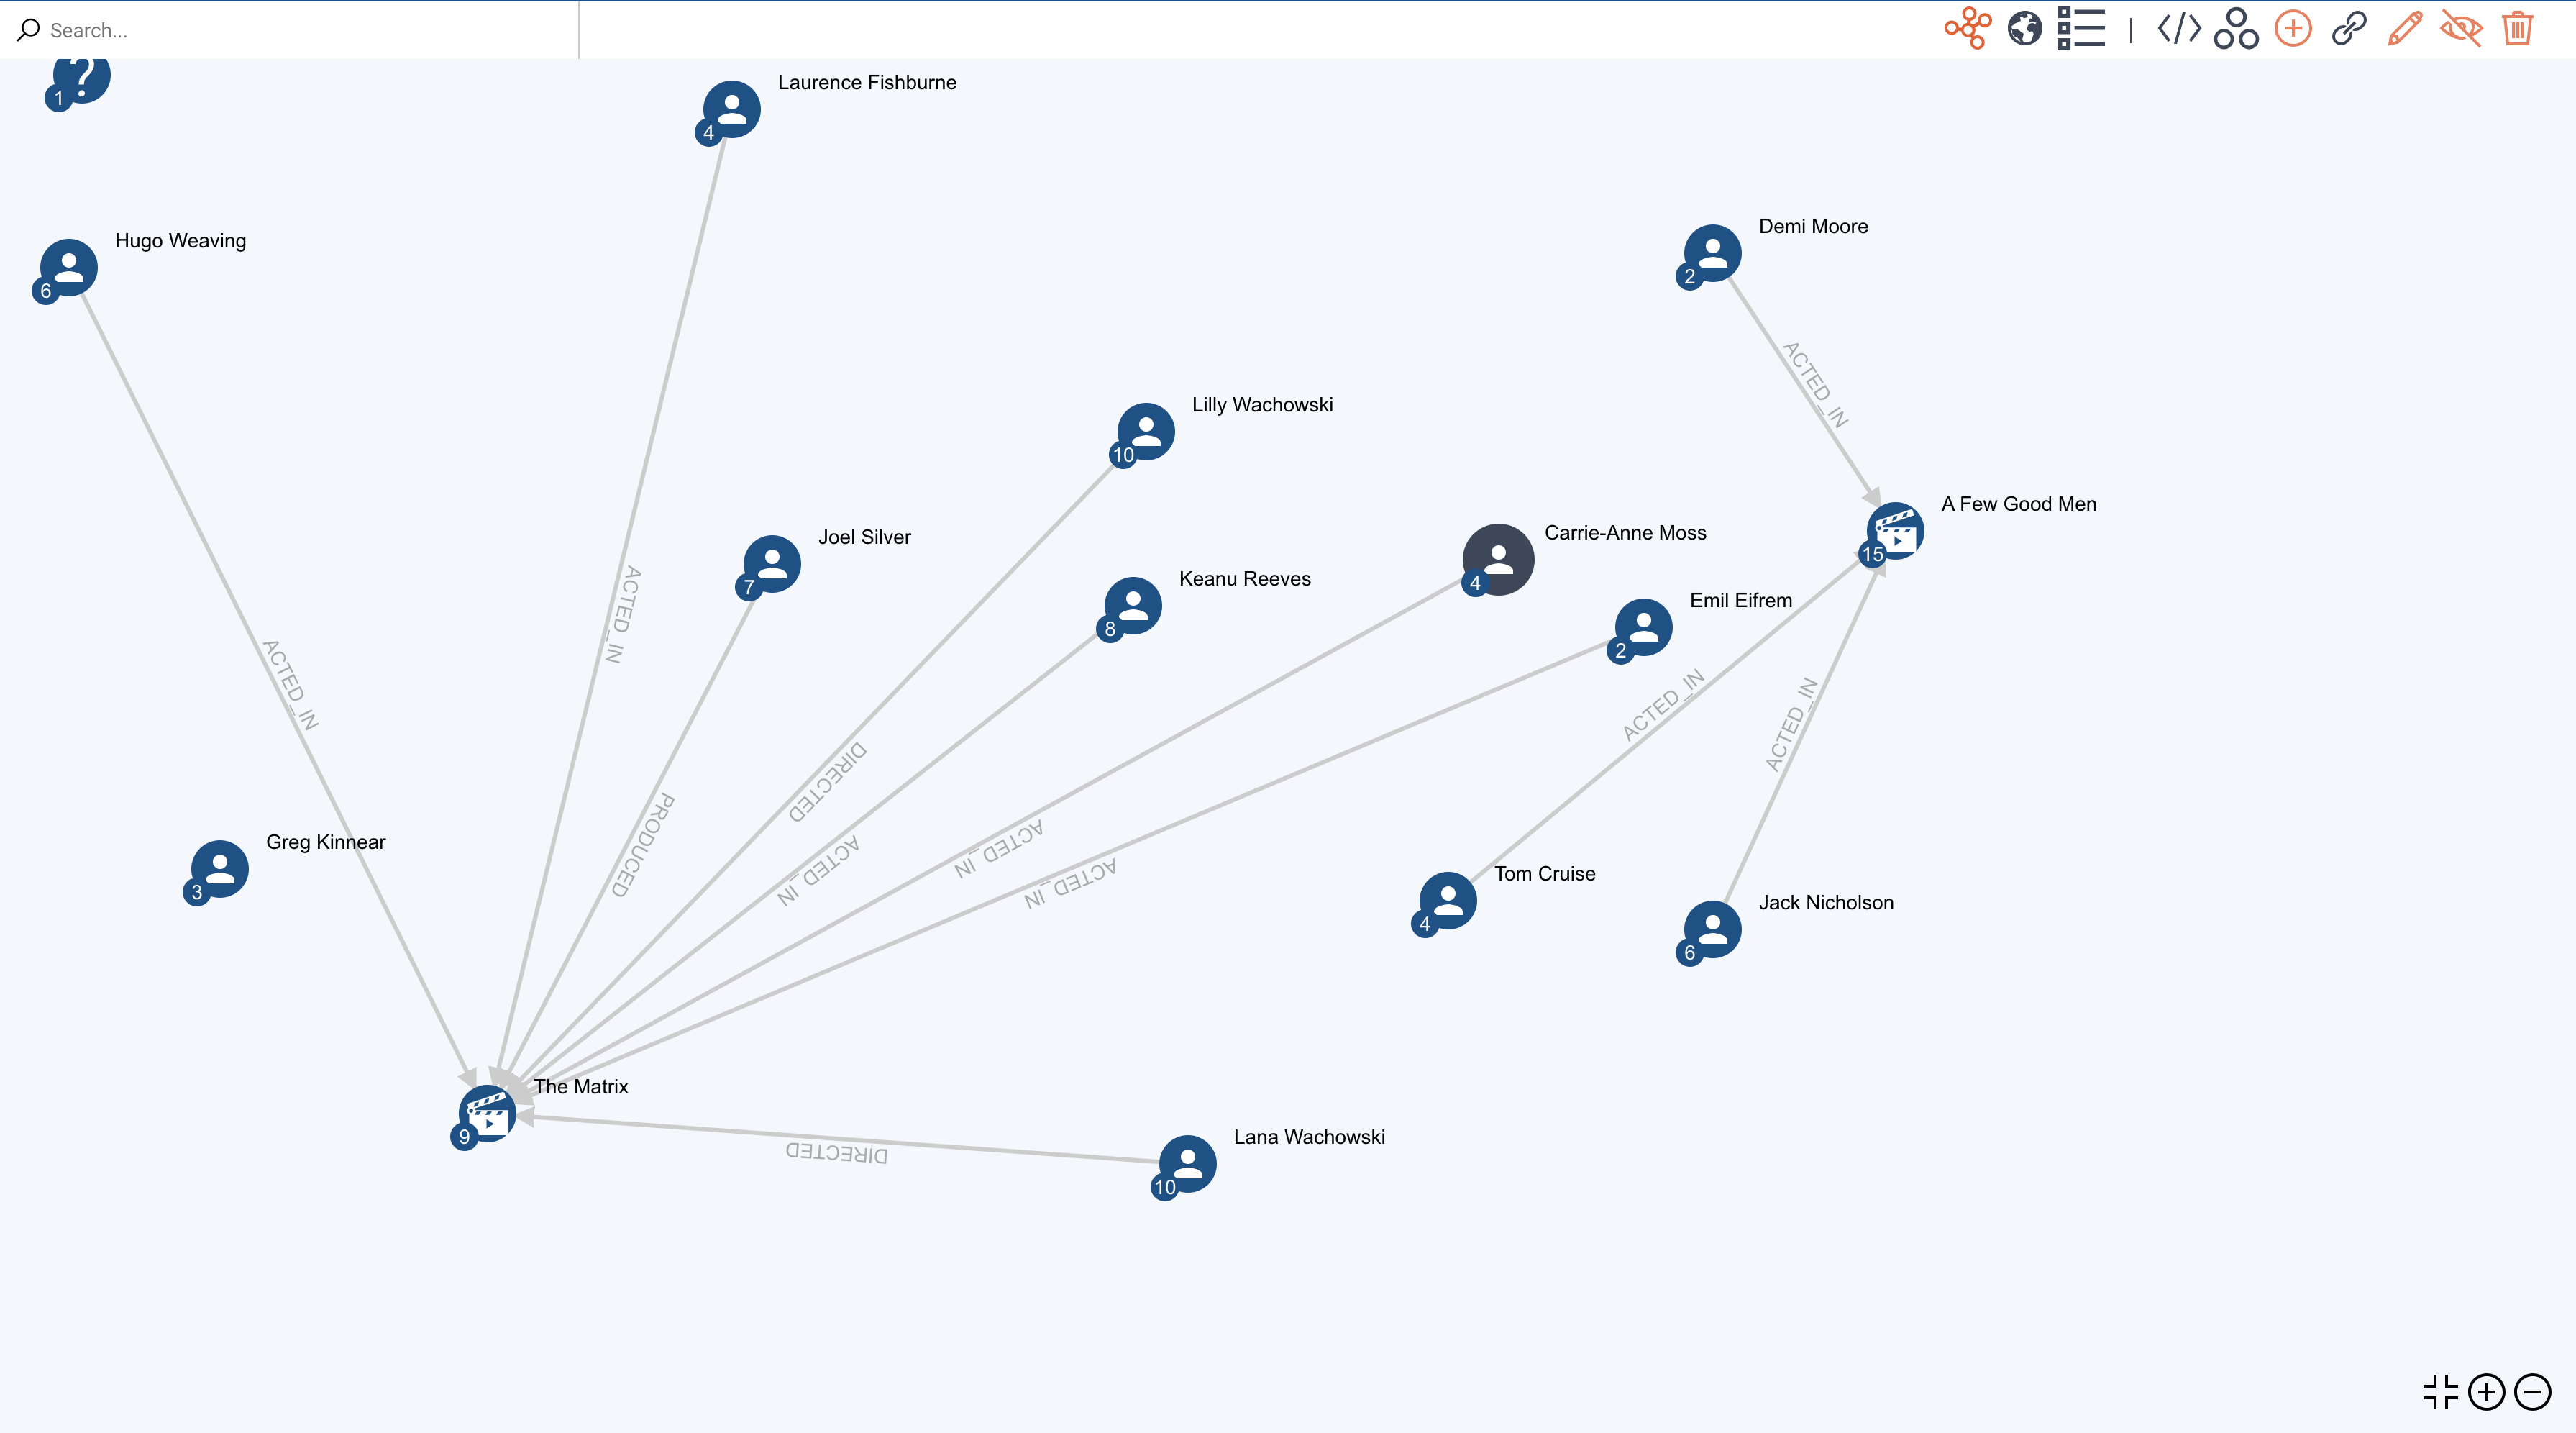
The buttons in the bottom right corner control zooming in and out of the graph and allow the user to return to center.
Global View

This view will bring up a global view; useful for organizations keeping track of data at a global scale.

Properties View

The properties view opens a table with of all the nodes and their properties that are displayed within the project.
Data Actions
The buttons to the right perform database actions.

Graph Query
The query button brings up the graph query editor.

Users can run graph queries directly from their Curator project.
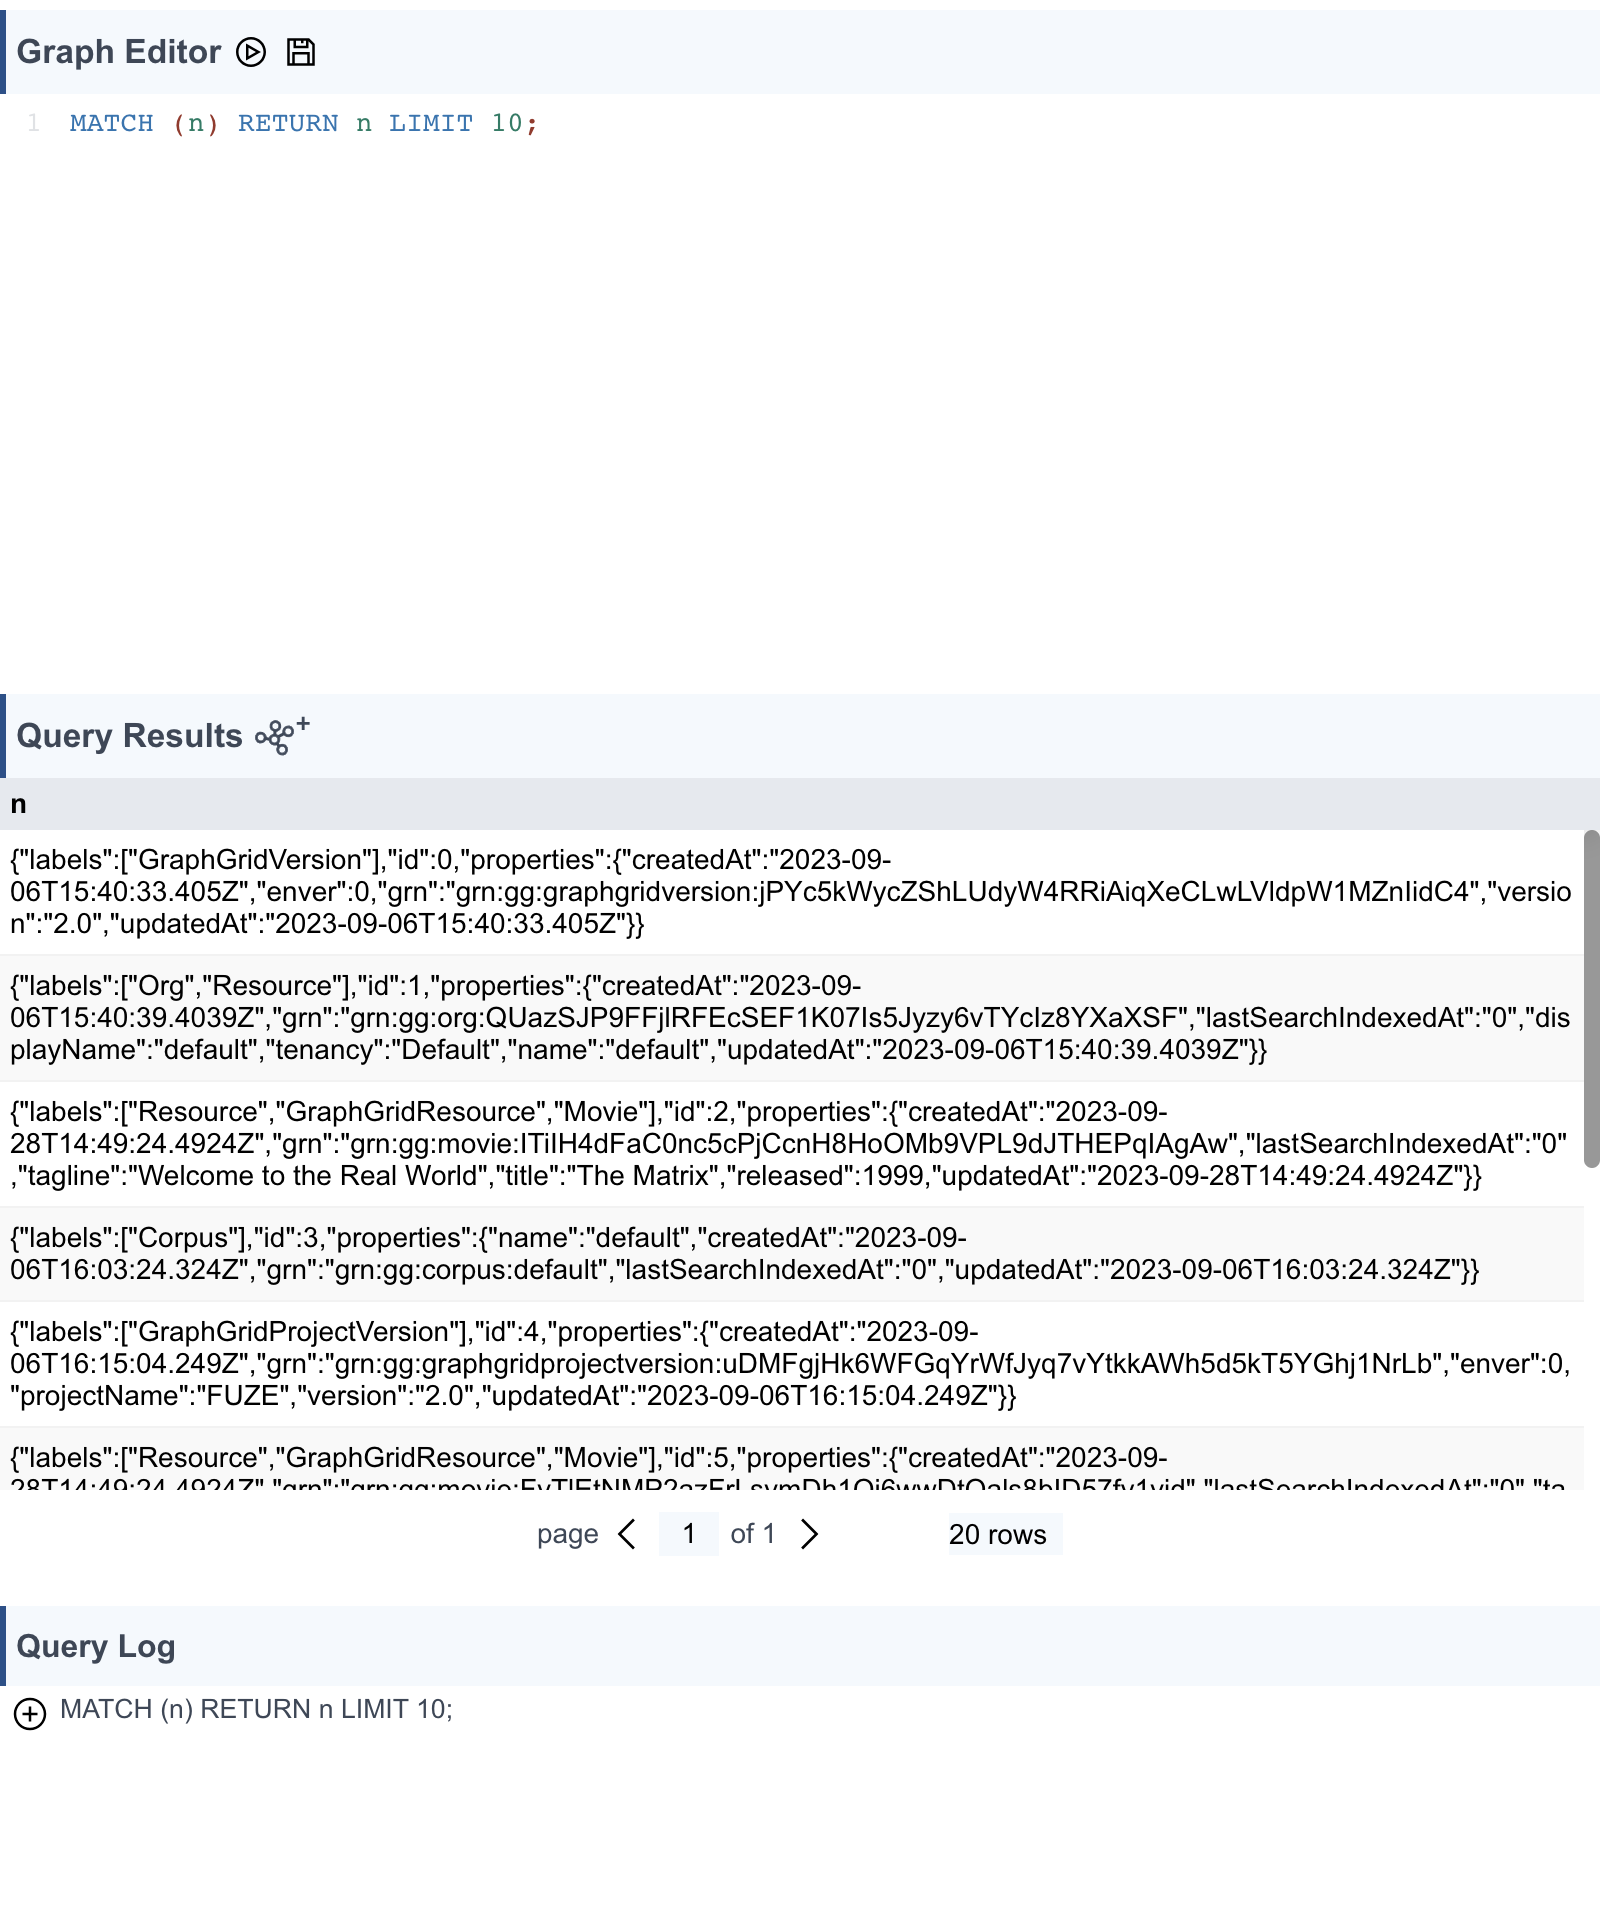
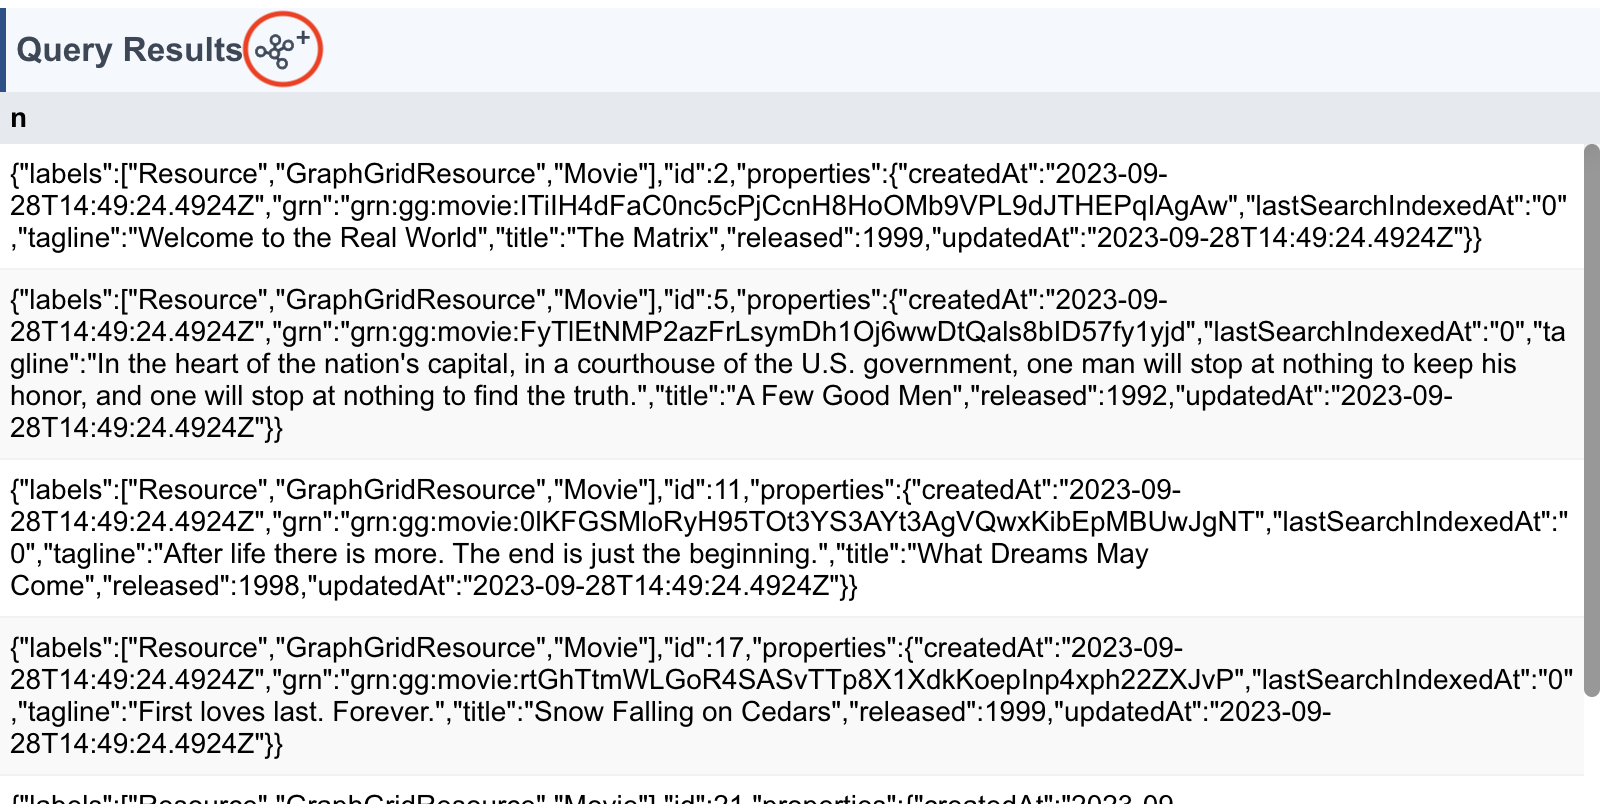
The graph query editor allows users to add query results directly to the graph. Use the button circled below to add the results to the graph.
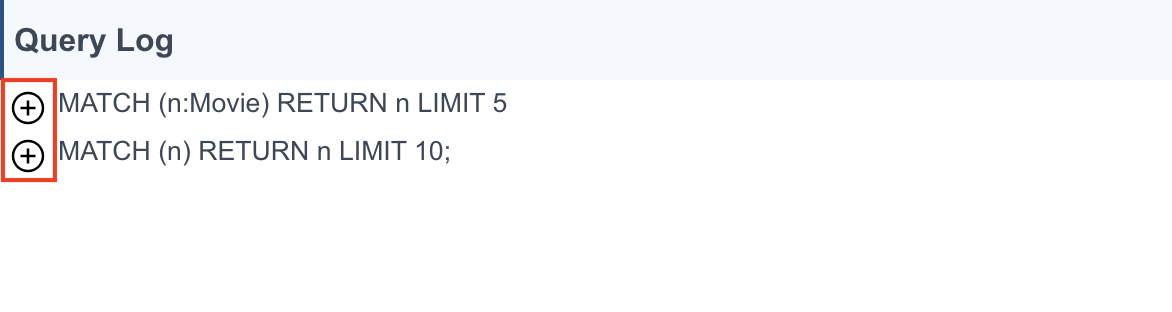
Previous graph queries are logged at the bottom of the editor and can be quickly selected again by clicking the plus sign to the right of the query.
Showme

The showme button brings up a menu of all available showmes for a selected node type based on its node label.
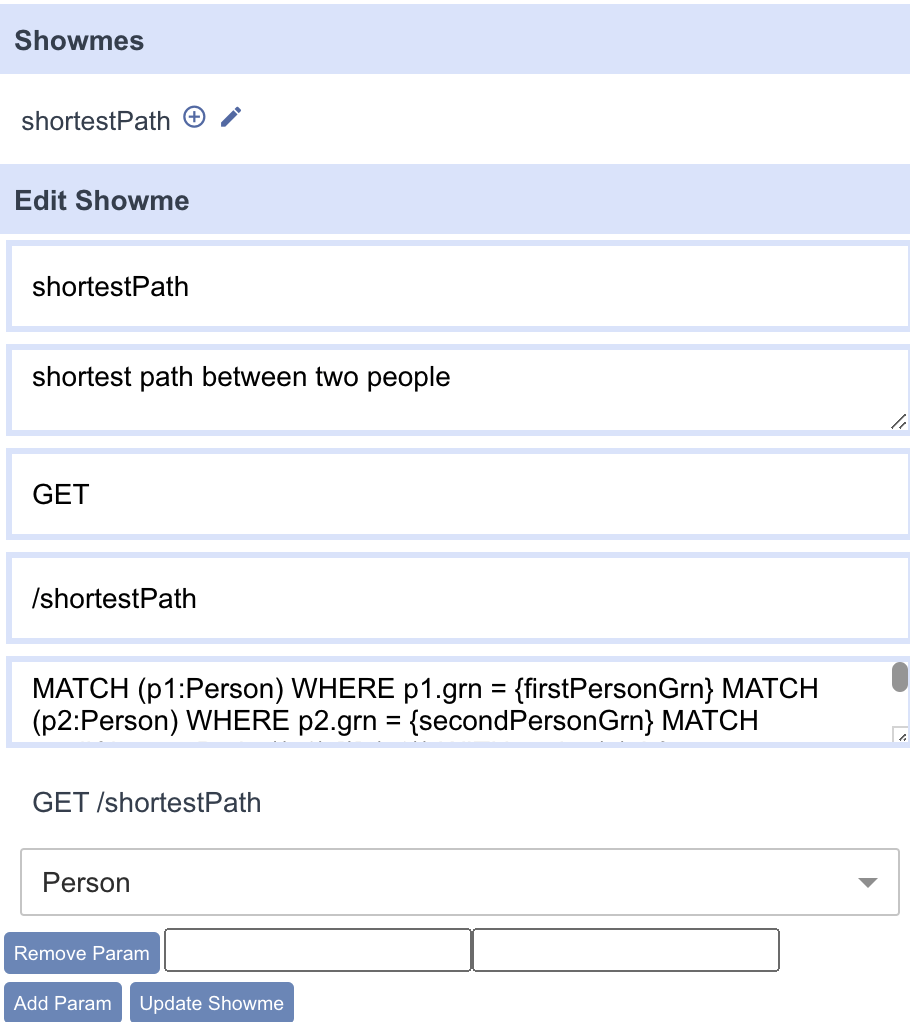
In this menu, users can edit and execute showmes to perform analysis on their chosen data. Updating the params will edit the showme.
Add Node

The add node button allows users to add a new node to the project without having to write any graph queries. This data is added and stored in ONgDB to be used in other Curator projects.
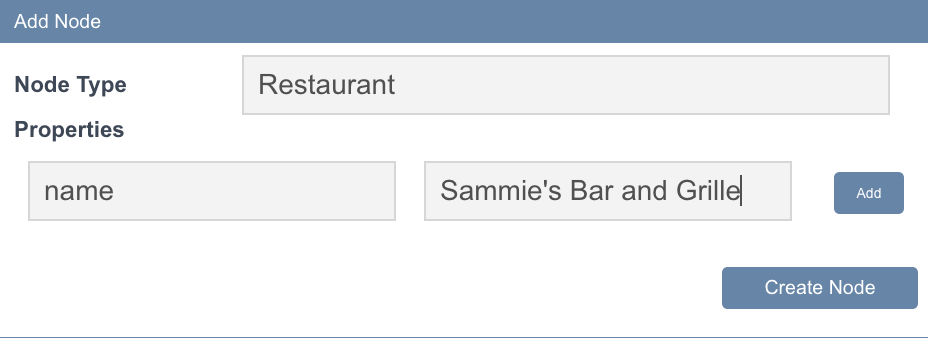

The requirements to add a node to the project are to set a label and any optional properties. Properties are set by 'key'
and 'value' pairs. For example, a node with a label called Restaurant would have a key of "name" and its value would be the name of the restaurant.
Add Edge

Similar to the add node button, this button allows the user to create an edge (or relationship) for a selected node. An edge has at least one label and properties that can be set directly in the Curator dashboard.
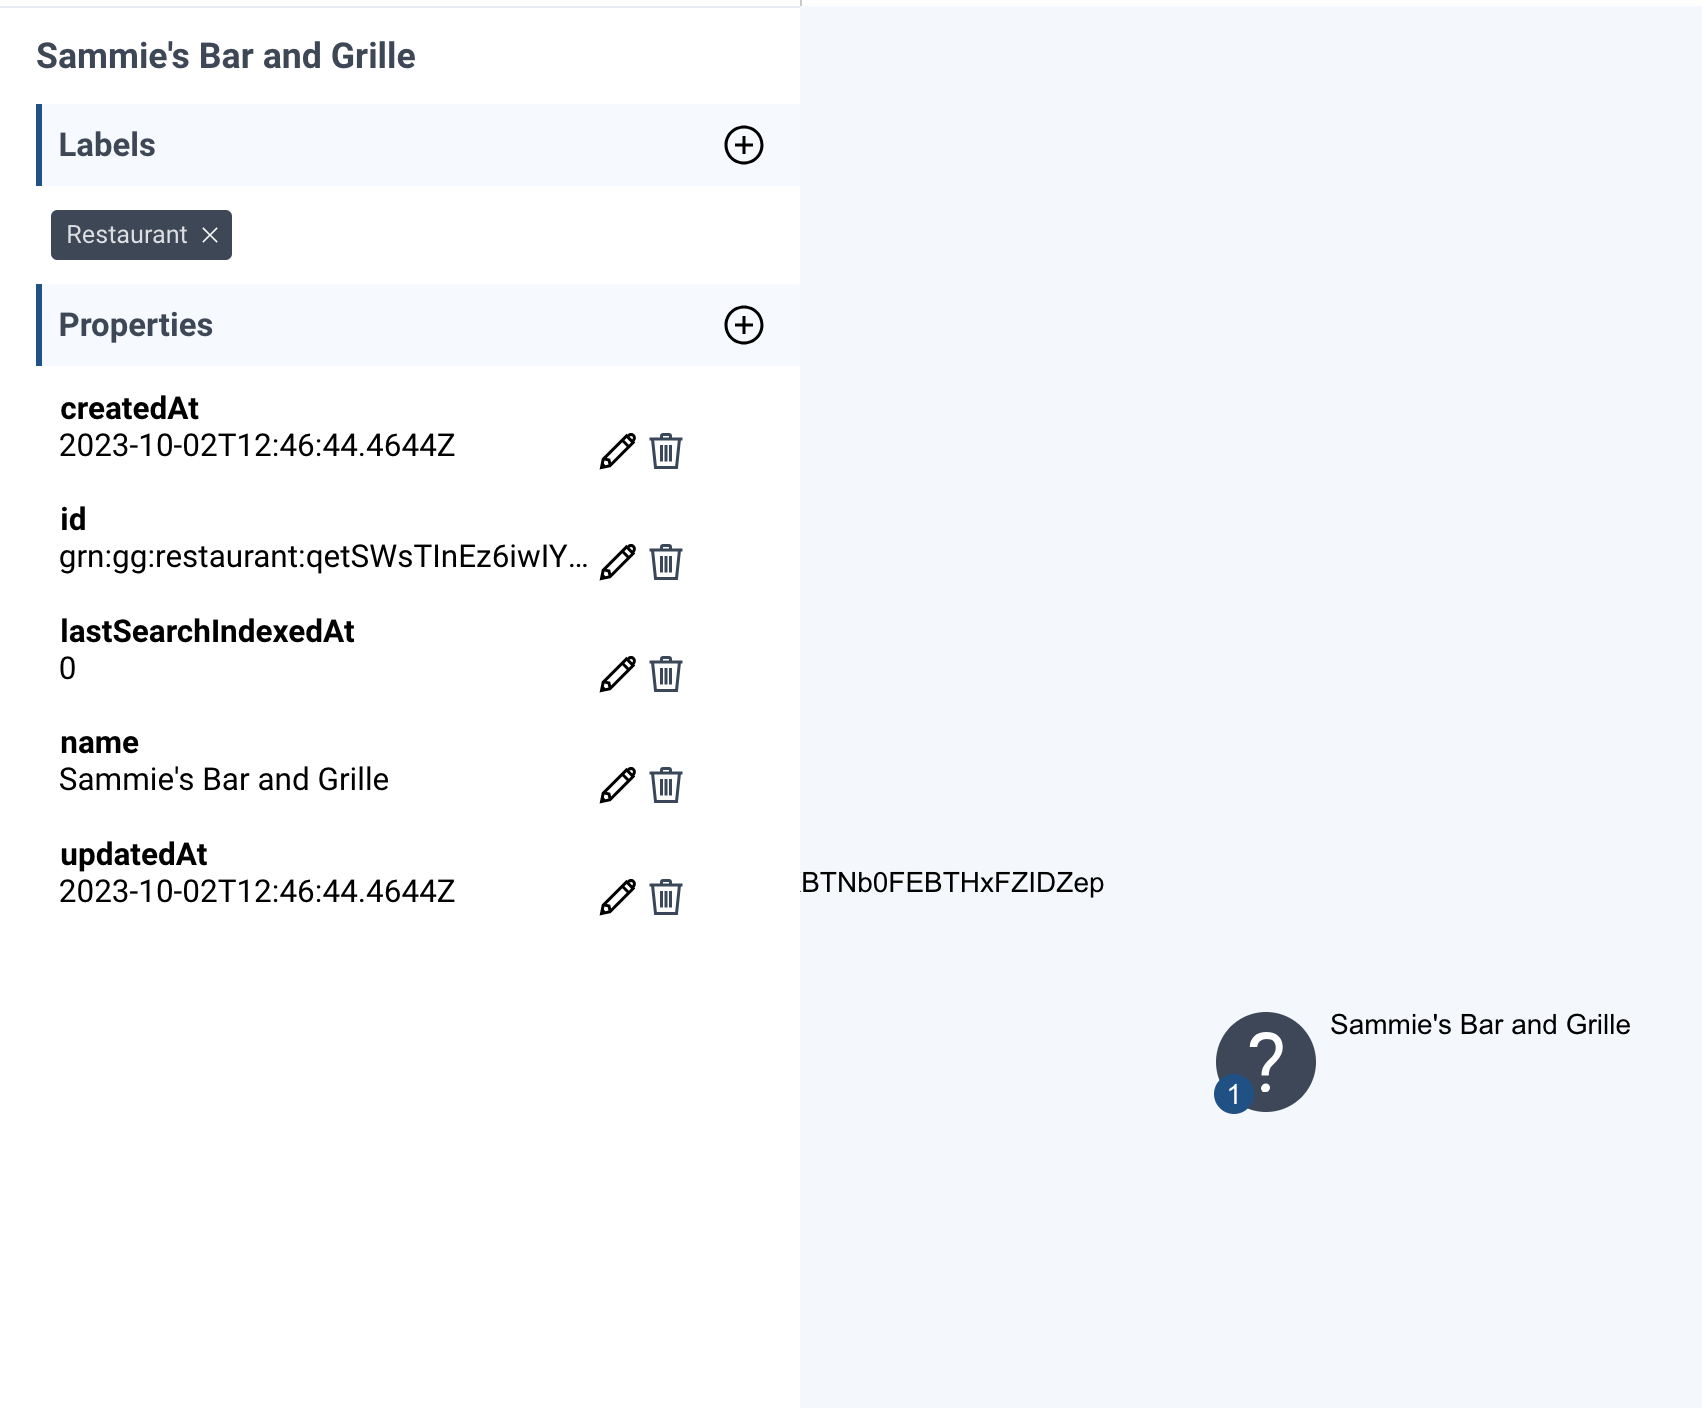
Edit

The edit button allows user to edit the selected node and its properties.
Visibility

The visibility button will hide the selected node and its edges. This allows users to only display the data they choose. To re-add the data, users will have to query and add the data back to the project.
Delete

This button will delete the selected node and its edges from the Curator project and from the graph database.
This will delete the data in the graph database (ONgDB). Deleting a node in the Curator project deletes it (and its edges) from the database so be mindful when using the delete button. Use the visibility button to hide a node in the Curator project rather than deleting it to ensure you are not deleting data that should not be deleted.